Start with the income
Enter annual gross rental income. Add operating expenses as a total, or use the itemized breakdown for taxes, insurance, maintenance, management and vacancy.
The rental property decision toolkit
Turn rental income and loan terms into a clear picture of debt coverage, cash flow and estimated borrowing capacity.
01 / Calculate
Enter annual income and expenses, then your loan details. Blank income and loan fields use the labeled example; blank expenses use an editable estimate.
Debt Service Coverage Ratio = net operating income ÷ annual debt service.
| Loan amount, interest rate | −2% | Your rate | +2% |
|---|---|---|---|
| Loan −10% | — | — | — |
| Your loan | — | — | — |
| Loan +10% | — | — | — |
Note. Results are informational estimates only and do not constitute financial advice or a loan offer. Balloon payments, blended portfolios and lender-specific requirements are not modeled. Confirm qualification with your lender.
This tool uses net operating income ÷ debt service. Residential DSCR mortgage programs may instead use rent ÷ PITIA. The methods differ, and a calculator result does not confirm loan approval. Compare the methods →
02 / Get started
Enter annual gross rental income. Add operating expenses as a total, or use the itemized breakdown for taxes, insurance, maintenance, management and vacancy.
Enter the loan amount, annual interest rate and amortization term. Advanced options let you change payment frequency or model interest-only payments.
Read your coverage and cash flow, choose a target ratio, and compare rate scenarios. Copy, share or save a PDF of the calculation.
03 / Understand
DSCR measures the income available for each unit of debt service. These ranges describe this calculator’s coverage bands, not universal lender eligibility rules.
Operating income does not cover modeled debt service. At 0.90, there is $0.90 available for every $1 owed.
At 1.00, operating income exactly covers debt service. Above that, there is a cushion, but unexpected costs can narrow it.
At 1.25, operating income is 25% above modeled debt service. Check the assumptions behind that cushion.
At 1.50, there is $1.50 of operating income for each $1 of debt service. Other property and financing risks still matter.
04 / The methodology
Debt service coverage ratio compares income available before loan payments with the payments themselves. Keep the numerator and denominator in the same time period.
Example: $62,400 ÷ $48,665 ≈ 1.28.
Annual gross income minus operating expenses. In this calculator, itemized vacancy and management are percentages of gross income. Debt payments are excluded from operating expenses.
The modeled principal-and-interest payment multiplied by payments per year. Interest-only mode includes interest without principal amortization.
The loan supported by NOI at your chosen target, rate and term. This is a mathematical estimate before loan-to-value limits, reserves, fees and lender rules.
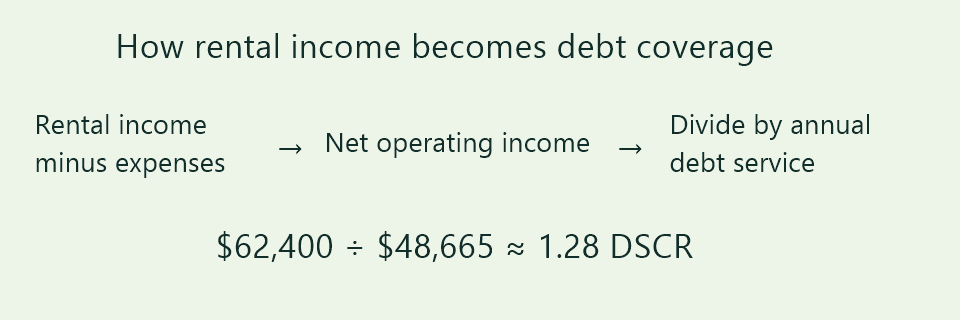
05 / A worked example
Consider $96,000 of annual rent and $33,600 in operating expenses. A $580,000 loan at 7.5%, amortized over 30 years with monthly payments, produces the estimates shown here.
Approximately $1.28 of operating income for each $1 of debt service.
| Gross rental income | $96,000 |
|---|---|
| Operating expenses | −$33,600 |
| Net operating income | $62,400 |
| Annual debt service | ≈ $48,665 |
| Cash flow after debt service | ≈ $13,735 |
| Loan capacity at 1.25 DSCR | ≈ $594,953 |
Rounded estimates. Capacity is based on the stated rate and term, not a financing offer.
06 / Explore your options
Compare realistic rent and vacancy scenarios. Higher income improves coverage only if it can be sustained; do not assume full occupancy by default.
Use actual taxes, insurance and management costs where possible. Compare efficient operations without removing necessary maintenance from the budget.
A smaller loan or lower rate can reduce debt service. Longer amortization and interest-only payments change cash flow and risks; compare the full terms.
07 / Know the difference
Two calculations can use the same DSCR name and produce different answers. Ask which method a lender uses before comparing your result with its criteria.
Subtract operating costs from income, then divide by principal and interest payments. Taxes and insurance belong in operating expenses here.
$62,400 ÷ $48,665 ≈ 1.28Compare monthly rent with principal, interest, taxes, insurance and association dues. This is a different underwriting calculation and is not the current mode of this tool.
Illustration: $2,500 ÷ $2,000 = 1.25Avoid subtracting taxes and insurance from income and also counting the same amounts in debt service.
08 / Common questions
Understand the inputs, the output and the limits before relying on a ratio.
This calculator divides annual net operating income by annual modeled debt service. Enter income and expenses for a full year. Loan terms are used to calculate principal and interest payments.
It means modeled operating income is 1.25 times modeled debt service, or 25% above it. It does not mean a 25% investment return or guarantee loan approval.
Include operating costs such as property taxes, insurance, maintenance, HOA dues and management. You can account for vacancy in the breakdown. Exclude principal and interest because the calculator models those separately.
A lender may use rent divided by PITIA, adjust eligible rental income, or apply its own expense assumptions. Confirm the calculation method and program rules instead of comparing ratios with different inputs.
Vacancy reduces available operating income and coverage. Interest-only payments omit principal during the modeled period and can raise the ratio, but future amortization or balloon obligations are not modeled.
No. It is the loan mathematically supported by the entered NOI, target, interest rate and term. Actual financing can also depend on property value, credit, reserves and lender criteria.
No. The currency selector changes formatting and symbols only. Enter all monetary amounts in the same currency.
No signup is needed to calculate or generate a PDF. Calculations run in your browser. If the site enables a follow-up form, submitting it stores the details described by that form.
Built on transparent calculations
This tool models a constant interest rate and the selected payment frequency. It excludes lender fees, changing rates, balloon payments, future rent changes and tax effects. Expense presets are editable illustrations, not market research.
These references explain different DSCR contexts. They do not endorse this tool. Check current program rules directly with a lender.
Make the next scenario clearer